2024-04: remove custom handling of histogram buckets, now supported by OpenTelemetry API natively.
2024-02: updated for OpenTelemetry 1.35.x and JVM instrumentation 2.1.x (JVM metrics renamed), add documentation about automatic instrumentation.
2023-06: updated for OpenTelemetry 1.27.x (new runtime-telemetry module and JVM metrics renamed).
Content of this article has been written with the OpenTelemetry version 1.21.x available as of December 2022. Post a comment if you notice something obsolete at the time of reading.
What is OpenTelemetry?
When someone mentions OpenTelemetry, it can actually refer to several things as OpenTelemetry is:
- a language-agnostic standard with a set of specifications for the 3 telemetry data types: metrics, traces and logs
- libraries for almost every language
- a protocol: OpenTelemetry Protocol (also known as OTLP)
- a “collector” to receive, process, and export telemetry data
It’s also important to note that OpenTelemetry is vendor-agnostic and allows you to use any “backend” you want for storing/analyzing telemetry data: Prometheus, Datadog, New Relic…
Why migrate?
The main reasons for migrating to OpenTelemetry are:
- be vendor-agnostic so that you don’t have to rewrite your applications if you change your backend provider in the future
- benefit from features not available in some vendors API
- unify the different types of telemetry data (metrics, traces, and logs) in a consistent cross-language API
- standardize your telemetry data pipelines (thanks to the OpenTelemetry Collector)
Architecture
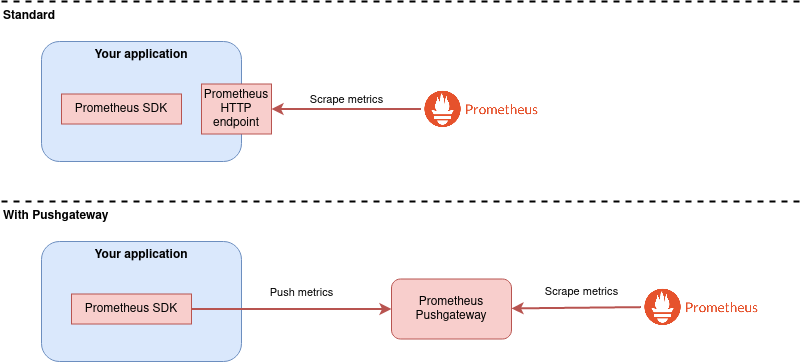
Prometheus is pull-based, meaning it regularly scrapes your application to collect metrics.
Most of the time, your application exposes metrics via an HTTP endpoint. In some cases (mainly for batch workload and not recommended otherwise) your application use the Prometheus Pushgateway in push-mode as a proxy.
With OpenTelemetry, you have several architecture options depending on whether you want to use OpenTelemetry collector or not, and whether your application is built with OpenTelemetry API/SDK yet or not.
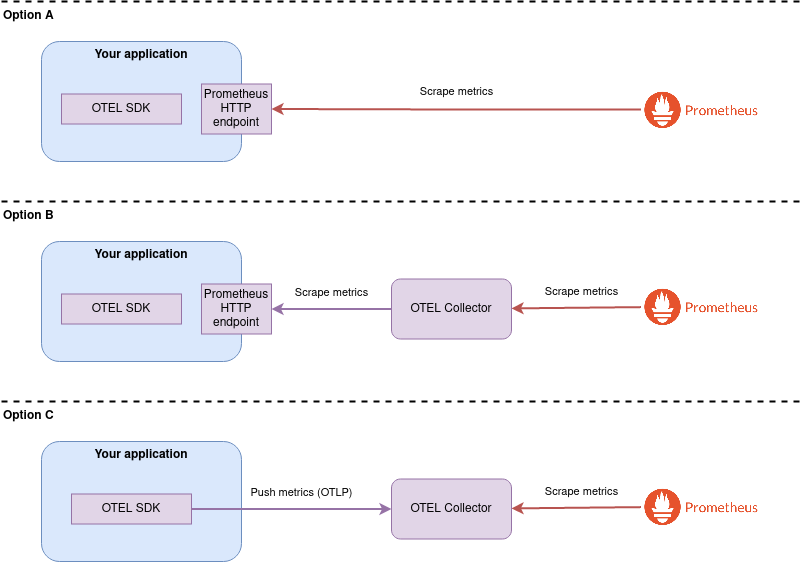
- Option A: your application uses the OpenTelemetry API/SDK but still exposes metrics as a Prometheus-compatible HTTP endpoint.
- Option B: you add the OpenTelemetry collector as a proxy between your application and Prometheus. This makes sense as an intermediate step before moving to Option C.
- Option C: your application becomes totally agnostic of Prometheus and pushes metrics in the OTLP format to OpenTelemetry collector.
This article will focus on Option A which in my opinion is the easiest to start with OpenTelemetry: nothing has to change in your architecture, only the way metrics are implemented by your application will change.
Using OTLP and the OpenTelemetry Collector have benefits but this can be done as a second step and will require discussion and preparation with your Ops team (if you have one).
Auto instrumentation vs. manual instrumentation
On the JVM, OpenTelemetry can be used in two ways:
- auto instrumentation: add OpenTelemetry JAR as a Java agent and let it automatically exposes metrics for the JVM and the frameworks/libraries your application is using.
- manual instrumentation: if your application exposes custom metrics and/or you want more control
Manual instrumentation can be used in combination with auto instrumentation. You should always start first with auto instrumentation and complete with manual instrumentation if you need it.
Note that it’s possible to not use auto instrumentation at all but some libraries support is only available in the auto instrumentation mode.
This article will document both setups when applicable.
API vs. SDK
OpenTelemetry instrumentation is built around the concept of API and SDK:
- the API allows you to define metrics and how they are computed
- the SDK allows you to define how metrics are processed and exposed
If you are writing:
- a library, then you should only care about the API
- an application and using auto instrumentation, then you should only care about the API
- an application and using manual instrumentation only, then you should use both the API and the SDK. Nevertheless, all your “business code” should only rely on the API and not the SDK. We will see below how this is achieved in practice.
Migrating from Prometheus
Dependencies
The first thing to do is to add the OpenTelemetry dependencies to your project as a replacement of the Prometheus ones.
For instance, if you are using Maven, you can remove the following dependencies:
<dependency>
    <groupId>io.prometheus</groupId>
    <artifactId>simpleclient</artifactId>
</dependency>
<dependency>
    <groupId>io.prometheus</groupId>
    <artifactId>simpleclient_hotspot</artifactId>
</dependency>
<dependency>
    <groupId>io.prometheus</groupId>
    <artifactId>simpleclient_httpserver</artifactId>
</dependency>
And add the following one as a replacement:
<dependency>
    <groupId>io.opentelemetry</groupId>
    <artifactId>opentelemetry-api</artifactId>
</dependency>
If not using auto-instrumentation, you may also add these ones:
<dependency>
    <groupId>io.opentelemetry</groupId>
    <artifactId>opentelemetry-sdk</artifactId>
</dependency>
<dependency>
    <groupId>io.opentelemetry</groupId>
    <artifactId>opentelemetry-exporter-prometheus</artifactId>
</dependency>
<dependency>
    <groupId>io.opentelemetry.instrumentation</groupId>
    <artifactId>opentelemetry-runtime-telemetry-java17</artifactId>
</dependency>
Note: the exact list of dependencies (and versions) you are using might vary. Here I assumed Prometheus metrics were exposed through the bundled Prometheus HTTP server and you were exposing JVM metrics.
As always, check out the latest available versions of OpenTelemetry dependencies. There are frequent updates and additions.
I recommend to use the BOM provided by OpenTelemetry to manage versions in your dependencyManagement section:
<dependency>
    <groupId>io.opentelemetry.instrumentation</groupId>
    <artifactId>opentelemetry-instrumentation-bom-alpha</artifactId>
    <type>pom</type>
</dependency>
Each dependency listed above plays a different role:
-
opentelemetry-apiis the main dependency that will allow you to define metrics.Most of the time, you should only depend on this one.
-
(manual instrumentation)
opentelemetry-sdkis useful to expose metrics. It’s a wrapper of other dependencies.It includes
opentelemetry-api.It also includes
opentelemetry-sdk-trace,opentelemetry-sdk-logs,opentelemetry-sdk-metrics, andopentelemetry-sdk-common. You could technically only depend on the last two if you won’t work with traces but only with metrics. -
(manual instrumentation)
opentelemetry-exporter-prometheusis the dependency needed to expose metrics as a Prometheus Exporter. If we were to push metrics directly to OpenTelemetry Collector, this would not be needed. -
(manual instrumentation)
opentelemetry-runtime-telemetry-java17is the equivalent of Prometheus’simpleclient_hotspot: it will allow exposing JVM metrics. If you don’t care about JVM metrics, you can skip this one. There’s also aopentelemetry-runtime-telemetry-java8if you’re not using Java17+ yet.
JVM metrics
JVM metrics give insights on CPU, memory, threads or garbage collector for instance.
With Prometheus, you would typically do the following to expose all available JVM metrics:
import io.prometheus.client.hotspot.DefaultExports

DefaultExports.initialize();
As of the day of writing these lines, there are slightly less JVM metrics exposed by OpenTelemetry than by Prometheus but all the major are most useful are. This might be of course evolve quickly if the community asks for it.
OpenTelemetry standardize the names of the metrics across languages and frameworks. As a consequence, the JVM metrics names are different between Prometheus and OpenTelemetry. See below a non-exhaustive mapping:
| Prometheus | OpenTelemetry |
|---|---|
pool (label) |
pool_name |
jvm_buffer_pool_xxx |
Not available yet in the public OTEL API (only in internal) |
jvm_classes_xxx |
jvm_class_xxx |
jvm_memory_pool_bytes_xxx |
jvm_memory_xxx |
jvm_memory_bytes_xxx |
jvm_memory_xxx |
jvm_threads_xxx |
jvm_thread_xxx |
jvm_gc_collection_xxx |
jvm_gc_xxx |
Auto instrumentation
When using auto instrumentation, this will be provided out-of-the-box by OpenTelemetry java agent.
Manual instrumentation
The same can be achieved with OpenTelemetry manual instrumentation using the following code:
import io.opentelemetry.api.OpenTelemetry
import io.opentelemetry.instrumentation.runtimemetrics.java8.*

OpenTelemetry otel = ... // Will be provided later (more below)

MemoryPools.registerObservers(otel);
Classes.registerObservers(otel);
Cpu.registerObservers(otel);
Threads.registerObservers(otel);
GarbageCollector.registerObservers(otel);
One important thing to note here is that you will need an OpenTelemetry instance to register the JVM observers. We’ll get back to how to obtain this instance and best practices later.
You can also notice we are talking about “observers” because these are metrics that will be “computed” only when asked for it. If you think of the memory instance, there is no metric that is continuously updated with the memory usage: it’s only when a value for the metric is asked (when Prometheus scrapes it for instance) that the value is actually computed or retrieved.
Custom metrics definition
Custom metrics give insight about your application in a specific way. Typically metrics related to your business.
Let’s take the example of a simple counter. With Prometheus you would define and use it like this:
import io.prometheus.client.*

// Definition
Counter myCounter = Counter
  .build()
  .name("myapp_mycounter")
  .help("Count of something")
  .labelNames("someLabel")
  .register();

// Usage
myCounter.labels("someLabelValue").inc();
With OpenTelemetry, the same can be achieved with following code:
import io.opentelemetry.api.OpenTelemetry
import io.opentelemetry.api.common.{AttributeKey, Attributes}
import io.opentelemetry.api.metrics.LongCounter

OpenTelemetry otel = ... // Will be provided later (more below)

Meter meter = otel.getMeter("com.mycompany.myapp");

// Definition
LongCounter myCounter = meter
  .counterBuilder("myapp_mycounter")
  .setDescription("Count of something")
  .setUnit("something")
  .build();

// Usage
myCounter.add(1, Attributes.of("someLabel", "someLabelValue"));
As for JVM metrics previously, we need a instance of OpenTelemetry and we’ll see later (below) how to provide it.
The differences with Prometheus are:
-
You need a
Meterinstance which kinda acts as a group of metrics. We won’t detail this part for now, you can just use your package name as meter name. -
The labels definition are not part of the counter itself but can be set “dynamically” when interacting with the counter
-
The counter is typed, it can be a
LongCounteror aDoubleCounter(you can useofDoubles()to convert from the former to the latter).
Other than that, it’s pretty much the same.
Note that this is slightly more complex for histograms. We will cover them later below.
Prometheus exporter
Once metrics are defined and used in your code, you want to expose them so that Prometheus can scrape them.
Here, we will consider that the metrics are exposed by a bundled Prometheus HTTP server.
With Prometheus API, this is only a matter of starting the HTTP server on a given port:
import io.prometheus.client.exporter.HTTPServer

int prometheusHttpPort = ... // Any port you'd like
HTTPServer prometheusServer = new HTTPServer(prometheusHttpPort);

// Close the server when stopping your app
prometheusServer.close();
Auto instrumentation
When using OpenTelemetry auto instrumentation, you only need to declare a JVM property or environment variable:
# JVM properties
otel.metrics.exporter=prometheus
otel.exporter.prometheus.port=0.0.0.0 # Default value
otel.exporter.prometheus.host=9464 # Default value

# Environment variables
OTEL_METRICS_EXPORTER=prometheus
OTEL_EXPORTER_PROMETHEUS_HOST=0.0.0.0 # Default value
OTEL_EXPORTER_PROMETHEUS_PORT=9464 # Default value
See the reference documentation.
If later you’d like to send metrics to OpenTelemetry Collector rather than exposing them as a Prometheus HTTP server, you would only need to change these variables.
Manual instrumentation
With OpenTelemetry manual instrumentation, you would do pretty much the same as with Prometheus:
import io.opentelemetry.exporter.prometheus.PrometheusHttpServer

int prometheusHttpPort = ... // Any port you'd like
PrometheusHttpServer prometheusServer = PrometheusHttpServer.builder().setPort(prometheusHttpPort).build();

// Close the server when stopping your app
prometheusServer.close();
The only difference is that if you do nothing more, there’s nothing that “connects” all the metrics we defined previously and this Prometheus HTTP server.
In manual instrumentation, we need to configure OpenTelemetry (SDK) to tie all this together.
Tying it all together
This part only makes sense if you are building an application. If you’re building a library, this is not your concern.
Auto instrumentation only
When using only auto instrumentation, you don’t have anything to do more except declare your application name:
# JVM properties
service.name="my-super-app"

# Environment variable
OTEL_SERVICE_NAME="my-super-app"
Auto instrumentation with custom metrics
If you’re using auto instrumentation but also have custom metrics (as we’ve seen above), you may have noticed that we have been referring to an OpenTelemetry instance previously but we still haven’t defined it.
It will actually be defined by the java agent and made available by using GlobalOpenTelemetry.get(). It is recommended to only call it once though and pass the reference wherever you need it.
For instance if you use Dependency Injection, you would make OpenTelemetry injectable where needed and the piece of code calling the GlobalOpenTelemetry could be a Provider<OpenTelemetry> :
import io.opentelemetry.api.OpenTelemetry

class MyMetrics {

  @Inject
  private OpenTelemetry otel;

  Meter meter = otel.getMeter("com.mycompany.myapp");

  // ... code defining metrics

}

import io.opentelemetry.api.GlobalOpenTelemetry

class OpenTelemetryService implements Provider<OpenTelemetry> {

  private OpenTelemetry globalOpenTelemetry = GlobalOpenTelemetry.get();

  public OpenTelemetry get() = {
    return globalOpenTelemetry;
  }

}
As in auto instrumentation only mode, you need to declare your application name:
# JVM properties
service.name="my-super-app"

# Environment variable
OTEL_SERVICE_NAME="my-super-app"
Full manual instrumentation
In full manual instrumentation, we need something to glue all the pieces we’ve seen before together.
Here is the code that we need to add:
import io.opentelemetry.api.OpenTelemetry
import io.opentelemetry.api.common.Attributes
import io.opentelemetry.sdk.OpenTelemetrySdk
import io.opentelemetry.sdk.metrics.*
import io.opentelemetry.sdk.resources.Resource
import io.opentelemetry.semconv.resource.attributes.ResourceAttributes

// Create a Resource to identify your application
Resource myAppResource = Resource
  .getDefault()
  .merge(Resource.create(Attributes.of(ResourceAttributes.SERVICE_NAME, "my-app")));

// Create a MeterProvider
SdkMeterProvider meterProvider = SdkMeterProvider
  .builder()
  .setResource(myAppResource)
  // prometheusServer instance we defined previously, should be provided somehow
  .registerMetricReader(prometheusServer)
  .build();

// Glue everything together
OpenTelemetrySdk openTelemetrySdk = OpenTelemetrySdk
    .builder()
    .setMeterProvider(meterProvider)
    .buildAndRegisterGlobal();
The key thing to note in this code is the binding between a “metric reader”, in our case the Prometheus HTTP Server Exporter, and the MeterProvider. The rest is just boilerplate at this stage.
If later you’d like to send metrics to OpenTelemetry Collector rather than exposing them as a Prometheus HTTP server, you would only need to replace the metric reader.
Okay, great, but… we referred to an
OpenTelemetryinstance previously and we still haven’t defined it!
Actually, we just did! The OpenTelemetrySdk instance above is also an instance of OpenTelemetry.
Now the question is how you make it available to the code we’ve seen previously defining metrics? The answer to this question depends on the way you build your application.
For instance if you use Dependency Injection, you would make OpenTelemetry injectable where needed and the piece of code defining the OpenTelemetrySdk could be a Provider<OpenTelemetry> :
class MyMetrics {

  @Inject
  private OpenTelemetry otel;

  Meter meter = otel.getMeter("com.mycompany.myapp");

  // ... code defining metrics

}

class OpenTelemetryService implements Provider<OpenTelemetry> {

  // ... code to setup OpenTelemetry

  OpenTelemetrySdk openTelemetrySdk = ...

  public OpenTelemetry get() = {
    return openTelemetrySdk;
  }

}
Tips & tricks
Histograms
Note that in early versions of OpenTelemetry, it was not possible to define the histogram buckets when defining the histograms.
Let’s see an example with Prometheus:
Histogram myHistogram = Histogram
    .build()
    .name("myapp_myhistogram")
    .help("Histogram of something")
    .labelNames("someLabel")
    .exponentialBuckets(1, 10, 9)
    .register();

// Using the histogram
myHistogram.labels("someLabelValue").observe(100d);
With OpenTelemetry, the histogram buckets are defined as an “advice”. An “advice” is meant as a suggestion that may be overriden later at the OpenTelemetry SDK level if needed.
This look’s like the following:
// Defining the histogram
LongHistogram myHistogram = meter
  .histogramBuilder("myapp_myhistogram")
  .setDescription("Histogram of something")
  .setUnit("something")
  .ofLongs()
  .setExplicitBucketBoundariesAdvice(Arrays.asList(1, 10, 100, ...))
  .build();

// Using the histogram
myHistogram.record(100, Attributes.of("someLabel", "someLabelValue"));
UpDownCounters (Gauges)
An interesting addition in OpenTelemetry API is an instrument called UpDownCounter which can replace one of the use case of Prometheus gauges: a counter that can be increased or decreased.
Gauges still exist in OpenTelemetry for other use cases.
Adding libraries or frameworks metrics
A lot of libraries and frameworks can be instrumented in the same way that we added JVM metrics previously.
For instance:
- Frameworks/servers: Akka, Jetty, Spring, Vertx
- Database connections pools: Apache DBCP, c3p0, HikariCP
- Databases: Cassandra, Elasticsearch
- Libraries: Guava, Hibernate
The complete list of instrumentations supported by OpenTelemetry is available directly on their GitHub: https://github.com/open-telemetry/opentelemetry-java-instrumentation/tree/main/instrumentation.
Other instrumentations might be offered by the community in other projects.
Auto instrumentation
Metrics of the libraries or frameworks you use will be exposed automatically.
However you can still remove or enable them one by one if you prefer via JVM properties or environment variables. See the reference documentation.
For instance:
# JVM property
otel.instrumentation.[name].enabled=false
otel.instrumentation.akka-actor.enabled=false

# Environment variable
OTEL_INSTRUMENTATION_[name]_ENABLED=false
OTEL_INSTRUMENTATION_AKKA_ACTOR_ENABLED=false
Manual instrumentation
These instrumentations are available with an additional dependency, like:
<dependency>
    <groupId>io.opentelemetry.instrumentation</groupId>
    <artifactId>opentelemetry-hikaricp-3.0</artifactId>
</dependency>
You then have to register it from your code somehow depending on the library.
Grafana dashboards
Community dashboards making use of OpenTelemetry metrics are still rare. Do not hesitate to contribute it if you write one.
Here are two dashboards that I created: